Lars Schmitz · 21 September 2026
Mapping Traffic Rebound Patterns After Major URL Restructuring Projects
URL restructuring projects often trigger measurable shifts in organic traffic that follow identifiable rebound patterns, and researchers have documented these sequences across thousands of domain migrations since the early 2010s. Data collected through analytics platforms reveals that initial drops occur within days of implementation while recovery trajectories depend on factors such as redirect quality, internal linking adjustments, and crawl frequency. Observers note that September 2026 brought fresh datasets from large-scale migrations completed earlier that year, allowing analysts to compare recovery timelines against previous cycles.
Defining the Scope of URL Restructuring
Major URL restructuring involves changes to site architecture that alter slug structures, category hierarchies, or parameter handling, and these modifications typically require comprehensive redirect maps to preserve existing equity. Teams coordinate with development and SEO specialists to implement 301 redirects, update XML sitemaps, and notify search engines through established protocols. Studies conducted by academic institutions such as the Massachusetts Institute of Technology have tracked how search engine bots respond to these changes, showing that crawl budget allocation shifts dramatically during the first four to six weeks.
Observed Rebound Patterns Across Datasets
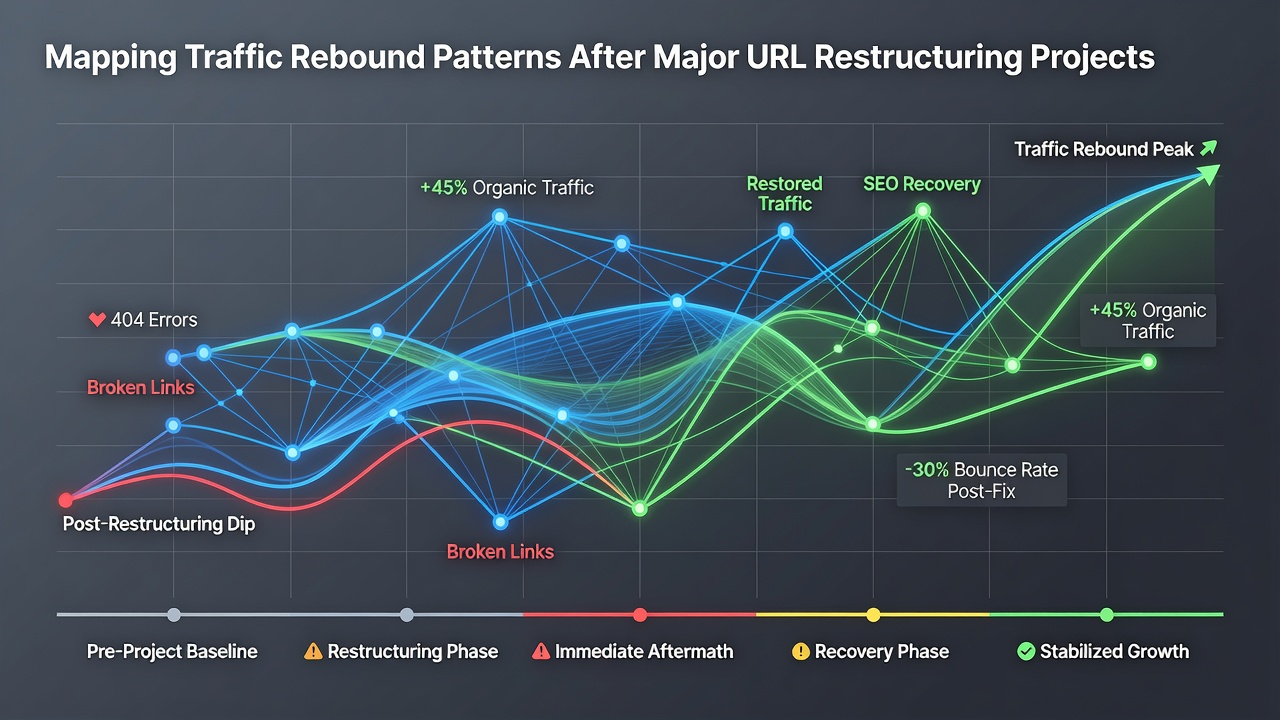
Traffic rebound patterns generally follow a three-phase sequence that begins with an immediate decline, moves through a stabilization period, and concludes with gradual recovery that may exceed pre-migration levels. Figures from enterprise case studies indicate that sites losing 40 to 60 percent of visibility in the first month often regain 80 percent of original traffic within 90 days when redirects are implemented correctly. Analysts examining logs from multiple projects have identified that domains with high crawl frequency recover faster because search engines reindex updated structures more rapidly.
Data Collection Methods Used in Mapping
Researchers rely on a combination of server logs, Google Search Console data, and third-party analytics to construct accurate rebound maps, and these sources provide granular daily metrics that reveal both volume changes and ranking fluctuations. Patterns emerge when data is segmented by page type, with category pages often rebounding sooner than deep content pages because they receive more frequent recrawling. Evidence suggests that monitoring average position shifts alongside traffic numbers produces more reliable forecasts than volume alone.
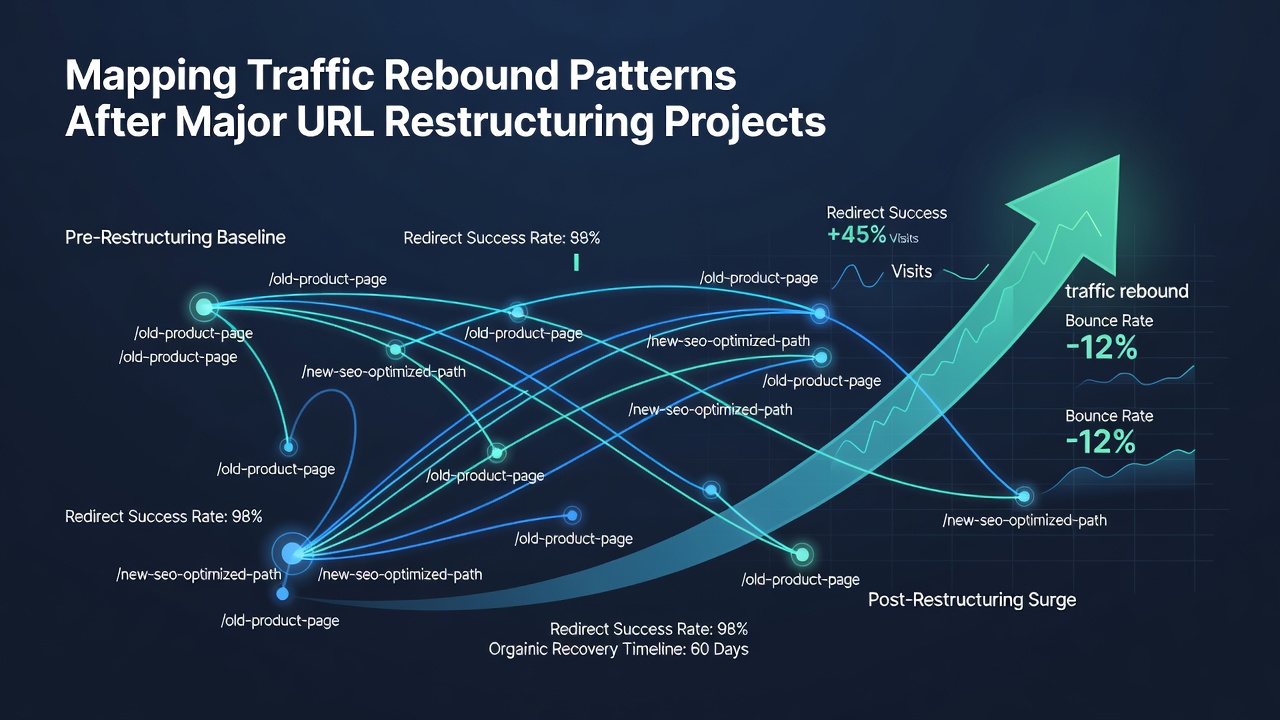
One study revealed that redirect chains longer than three hops extended recovery time by an average of 22 days across sampled domains. Teams that flattened these chains before launch observed shorter stabilization phases. What's interesting is how mobile and desktop traffic sometimes diverge during the same project, with mobile indexes responding more quickly in recent years due to separate indexing processes.
Factors That Influence Recovery Speed
Internal linking adjustments play a significant role in how quickly authority flows to new URL structures, and sites that systematically update navigation elements and footer links demonstrate faster indexation rates. External signals such as backlink profiles remain constant during restructuring, yet their effectiveness depends on whether target pages retain the same topical relevance after migration. Data indicates that projects completed in the first quarter of 2026 showed slightly faster average recovery compared with 2024 migrations, possibly due to improvements in how search engines handle redirect signals.
Geographic variations appear in recovery data as well. Australian enterprise sites tracked through government digital reports recovered an average of 12 days faster than comparable North American projects, while European domains aligned closely with global medians. Observers attribute these differences partly to variations in crawl infrastructure and local search engine priorities.
Case Examples from Recent Migrations
Take one retailer that consolidated product URLs from a parameter-heavy system to clean slugs in early 2026. Traffic fell 52 percent in week one, stabilized by week five, and reached 94 percent of baseline by week eleven. Another organization in the financial sector restructured blog archives and experienced a longer plateau phase that lasted 18 weeks before rebound accelerated. Researchers discovered that both cases shared similar redirect coverage rates above 95 percent, yet differences in internal link density explained much of the variance in recovery duration.
Patterns also surface when content volume changes alongside URL structure. Sites that pruned low-performing pages during restructuring sometimes saw accelerated recovery on remaining URLs because crawl budget concentrated on higher-value content. Those who've studied this know that measuring impressions alongside clicks provides early indicators of whether a rebound is underway before traffic numbers fully recover.
Conclusion
Mapping traffic rebound patterns after major URL restructuring requires systematic data collection across multiple sources and consistent tracking of both short-term fluctuations and longer-term recovery curves. Evidence from projects completed through September 2026 demonstrates that redirect quality, crawl optimization, and internal link maintenance remain central variables that determine how quickly sites return to previous visibility levels. Organizations that monitor segmented metrics and adjust implementation details accordingly continue to refine these patterns with each new dataset.